Friday, July 10th, today’s news—oil prices drop again due to expectations of lower demand amid the record surge in coronavirus cases. The same cause is behind the negative trends in the US, EU, and Asian markets, the latter are also affected by the US-China tensions. The price of Brent oil is $43.27, WTI—$40.78. EUR/USD is at 1.1334, GBP/USD— 1.2544, gold is $1,810.65 per ounce. Read the daily selection of analytical reviews from Grand Capital experts to navigate the market during a time of volatility.
What happened to S&P, DJI, NASDAQ, who lost all profit and who remains afloat: the state of the US economy in the new video by our Chief Analyst Vladimir Rojankovski. Subscribe to our YouTube channel and never miss an update!
The pair is balancing near 1.1260 amid falling risk appetite in financial markets and growing demand for the dollar as a safe-haven currency. If market sentiment doesn't improve, the pair will continue to decline. At the same time, a positive turn of sentiment will result in further growth. Keep track of the rate changes in real time.

Trading recommendations: if the price holds above 1.1260, it may rise to 1.1345. If it drops below this level, it will continue down to 1.1190.
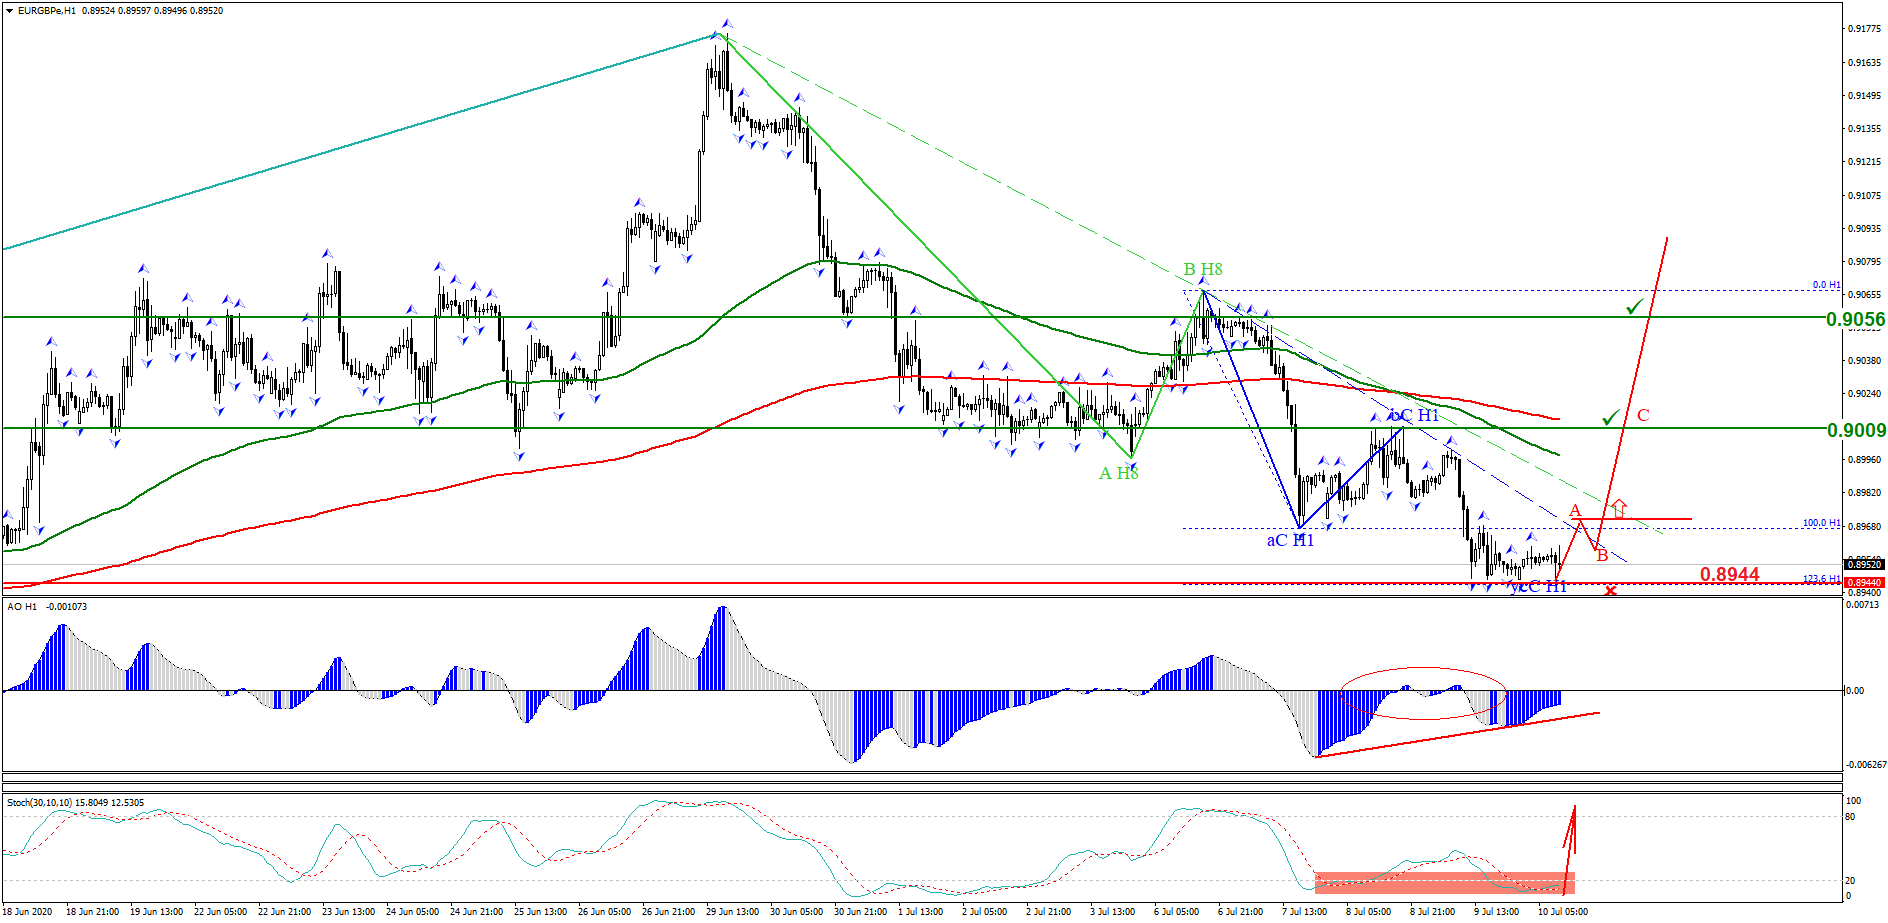
The 0.8944 support level is holding back sellers. The descending H1 level pattern is currently truncated. Stochastic Oscillator indicates an oversold situation, and Awesome Oscillator shows a bullish divergence. Keep track of the rate changes in real time.

Trading recommendations: buy when an ascending wave pattern is formed, where wave A breaks through the inclined channel of the descending truncated H1 level pattern.
A descending truncated pattern has formed. Awesome Oscillator shows a bullish divergence, while Stochastic Oscillator indicates an oversold condition. Keep track of the rate changes in real time.

Trading recommendations: buy when an ascending wave pattern is formed, where the wave (A) breaks through the inclined channel of the descending pattern.
Visit the new section on Grand Capital website to monitor the rate changes of your preferred instruments and get useful information to help you decide on a trading strategy.
*Trading recommendations offered by analysts do not constitute a solicitation. Before starting to trade on currency exchange markets, please make sure that you understand the risks connected with the use of leverage and that you have sufficient level of training.